Modeling Price Elasticity for an Optimized Pricing Strategy

How to model price elasticity to inform your pricing strategies, understand price perception, and service shoppers better
Price elasticity is a key element when it comes to setting prices that will meet your business goals. However, understanding the basic relationship between price and demand for your products is just the beginning. With a deep grasp of elasticity and how to leverage it effectively, retailers can optimize their prices for a dynamic retail landscape.
Modeling price elasticity can help show retailers what pricing strategy to take on key items and categories, how to differentiate promotional elasticity, and more. But before we launch into how to use the model, let’s look further at the impact price elasticity can have.
Why Price Elasticity is Important
Scientific Objectivity:
Call it natural curiosity, call it an affinity for science. But whatever the reason, humans love to know “why”. More often than not, elasticity is at the core of the pricing strategy why. When refined through observation and experimentation, it provides an objective lens for you to explore more profitable pricing decisions.
Information Asymmetry:
The internet has made competition fiercer by dramatically diminishing asymmetric retail information, or the leverage retailers used to have as owners of all the pricing information. If a shopper has more recent competitive pricing information than your last competitive pricing action, I would argue they can infer more about your competitive index in that moment than you can. This scenario exposes retailers to decreased sales, increased inventory cost, margin erosion, and the risk of negatively impacting price perception, which could be severely detrimental in the long-term if mishandled.
Strategic Alignment:
Have you ever driven a car with poor wheel alignment? By design, each tire should be perfectly aligned and pointed in the right direction. Poor alignment makes it more challenging to steer, your car may drift out of your lane, and you no longer get the same gas mileage. When your pricing strategy isn’t aligned with price elasticity, you are at risk of losing margin or units and adversely impacting price perception. Also, just as your car needs an occasional alignment, price elasticities need to be recalibrated as new sales are generated at various price points.
However, when it comes to price elasticity, the biggest problem retailers often face is how to scale. When you have hundreds of thousands of products across hundreds of stores, how do you efficiently calculate each elasticity? This is where AI based modeling and automation come into play.
Modeling Price Elasticity
The Data Model Approach
The classic econometric definition of elasticity, while simple to calculate, is not scalable. To determine elasticity at scale, you could model the relationship between price and quantity in a way that allows each product to vary in scale (velocity) and price sensitivity. This is moving away from the traditional point estimate of elasticity and allows you to estimate demand behaviors of a specific price that may not have been explored in the past. From there you could optimize the trade-off between profit, units and revenue based on price specific business objectives.
One thing to keep in mind is that modeling is a curve-fitting exercise that provides model parameters and does not produce elasticity by itself. When modeling elasticity, you can provide estimates of elasticity at different price point while modeling other demand factors. The beauty in this approach is that you can account for and control other demand influencing factors such as the availability and closeness of substitutes or the seasonal impact on demand to ensure you have the purest read on price elasticity.
This modeling approach helps to get the best available information at the lowest SKU-store level even when the data is sparse.
Now, we can introduce a new metric called lambda, which is simply the trade-off between profit and revenue, where the slope of the curve represents elasticity. For every dollar of revenue gained, you lose lambda dollars of profit. If the lambda is low, you are better off focusing on revenue with a traffic driver strategy. If lambda is high, go for a margin enhancer strategy to drive profit.
Modeling Price Elasticity to Drive Strategy
To understand the chart, if you start from the blue point and go all the way to the red point, the price goes from infinity down to zero monotonically. This curve represents the relationship between profit and revenue. Once you have a demand model, you can simulate the curve by substituting different price values from zero to infinity and see how profit and revenue change.
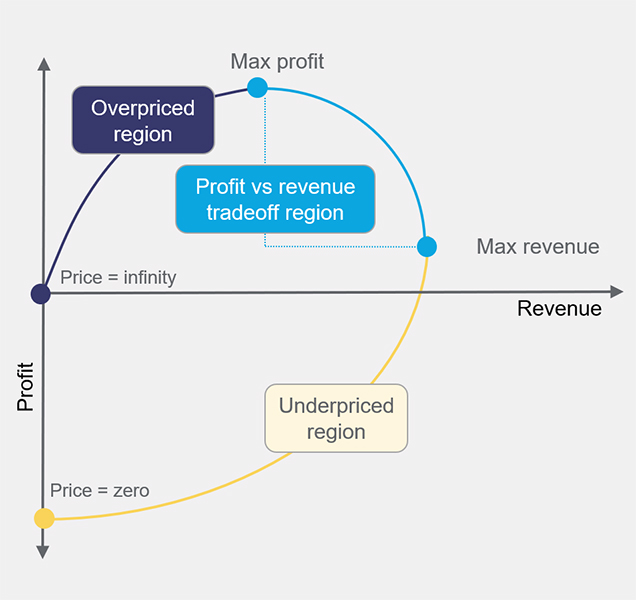
Underpriced Region
In the red part of the curve, prices are below the revenue-maximizing price. This is also where elasticity is precisely equal to 1.0. If we decrease prices, elasticity drops below 1, thus the demand does not increase enough to compensate. Both revenue and profit will fall with price decreases. For products in this region, a margin enhancer strategy will help push prices towards the trade-off region.
Overprice Region
The black part of the curve shows prices that have been increased above the profit-maximizing point. In this region, we also have an elasticity greater than 1. As demand continues to decrease, the price increase is not making up for it, resulting in lower profits. So, again we have both revenue and profit falling. The black part of the curve also has negative lambda. For the overprice region, retailers should use a traffic driver strategy to bring prices closer to optimization.
Trade-off Region
Lastly, the sweet spot. The green part of the efficient frontier above holds the positive lambdas. Here we trade off between profit and revenue, meaning as profit increases, revenue decreases. At and near the revenue-maximizing point on the curve, lambda is nearly negative infinity. This is where we would recommend a margin enhancer strategy. At and near the profit-maximizing point on the curve, lambda is a small number, and we would suggest a traffic-driver strategy.
Taking Price Elasticity Even Deeper
Once you can identify where a product falls on the curve, you can leverage the price elasticity model to strategical manage price perception in a way that meets shopper expectations. From there, you can layer in a few additional data points to understand:
- What percentage of your assortment is low elastic, background items, that can afford to take price increases without diminishing sales
- How to segment your business from a bottom-up approach and leverage price elasticity to provide a statistically relevant understanding of price perception
- How to combine price elasticity with other demand influencing factors to better understand what drives a purchasing decision.
And the list goes on.
If you are not leveraging price elasticity to inform pricing decisions, you are blindly navigating the retail landscape. Being able to calculate millions of elasticity values effectively and dynamically adapt them as demand shifts is impossible without the help of an AI pricing platform. However, with the right pricing solution that is adaptive and extensible, retailers can assure more value generation, improved forecasting capabilities, and the ability to understand and respond to consumer expectations. At Revionics, we can help you find the correct balance of price increases and decreases to maximize results and hit vital business objectives.
Maisie is a content marketer and copywriter specializing in B2B SaaS, ecommerce and retail. She's constantly in pursuit of the perfect combination of words, and a good donut.